Back in ConfigMgr TP2008, Microsoft added the ability to monitor the health of an environment beyond what we currently have, with a new feature called Scenario health.
Initially the focus was on the SQL Server Service Broker. and in TP 2010 this has been extended out to the Client action health scenario.
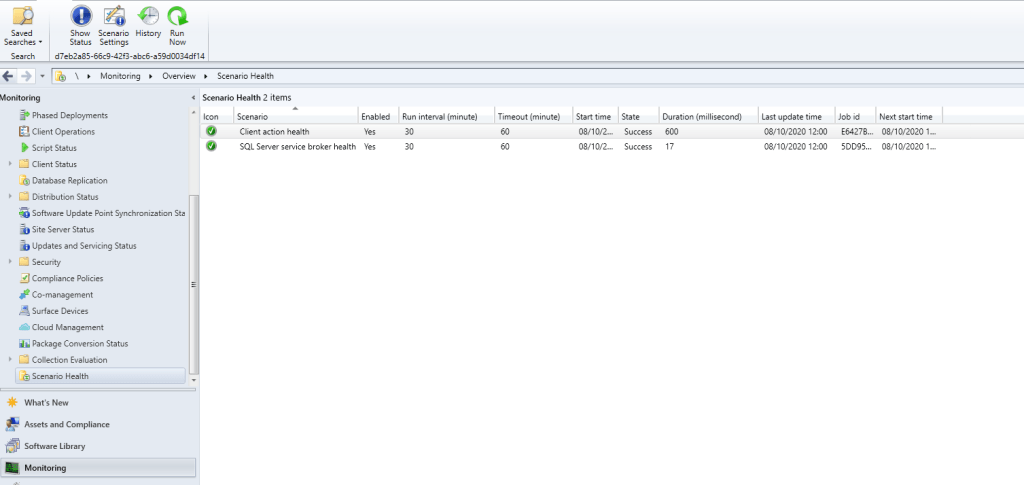
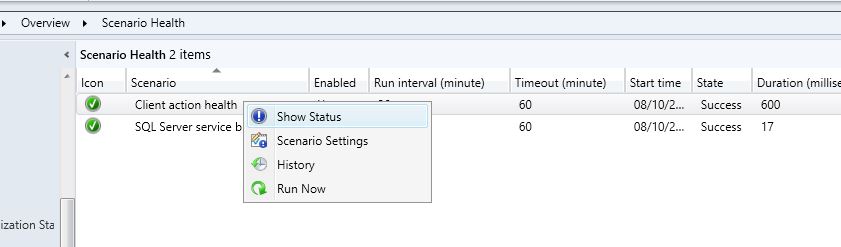
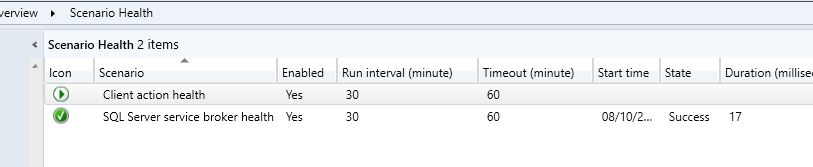
Accessing the feature is easy enough, head on over to Monitoring\Overview\Scenario Health in the ConfigMgr console. You’ll see both scenarios listed.
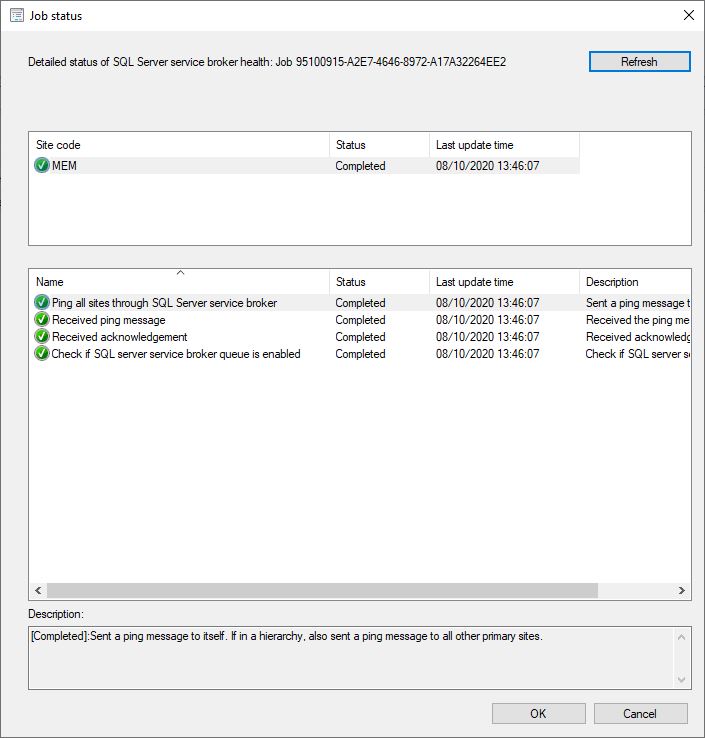
Clicking into the SQL Server service broker health will give you an overview of the status on that service in your environment. All is looking good in my TP lab.
But what if we have a problem? Well we’ll get some information back on the problem and where to investigate.
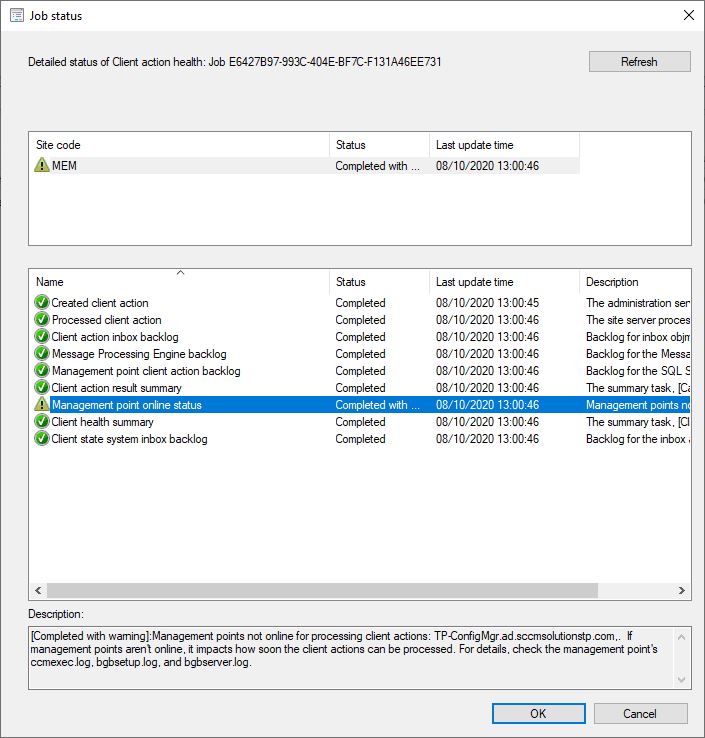
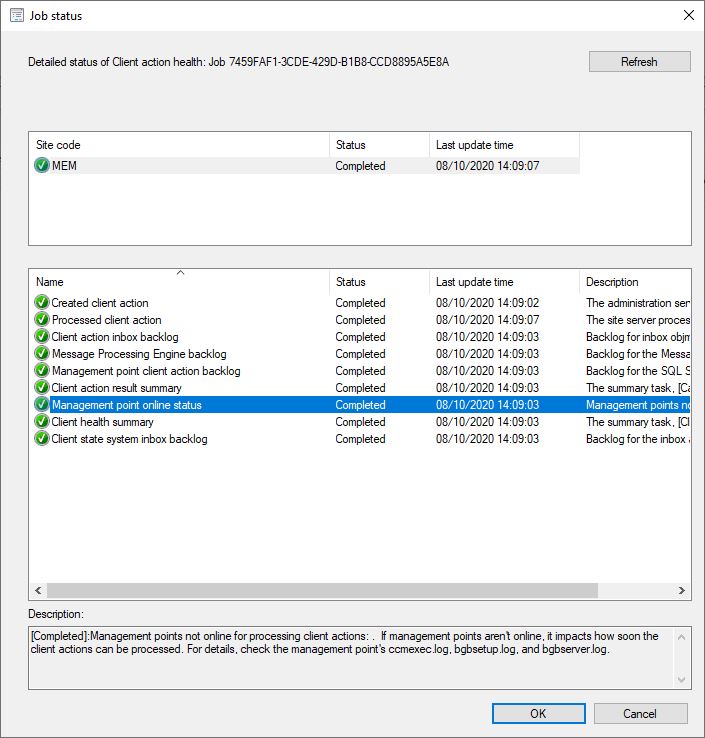
In my Client action health scenario, I had a warning about my Management Point.
To view this, right click the scenario and choose Show Status.

You’ll get the scenario details back. As you can see, a warning from the Management Point online status. The description field advises me to check the ccmexec, bgbsetup and bgbserver log files on the MP server.
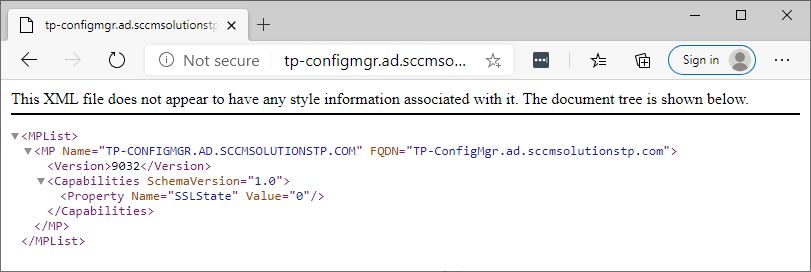
First up, I thought it would be worth checking the status of my Management Point. Site and Component Status all looked good in the console and a quick check of the MP health via the MP URL http://<ServerName.FQDN>/sms_mp/.sms_aut?mplist, again, showed things were OK.
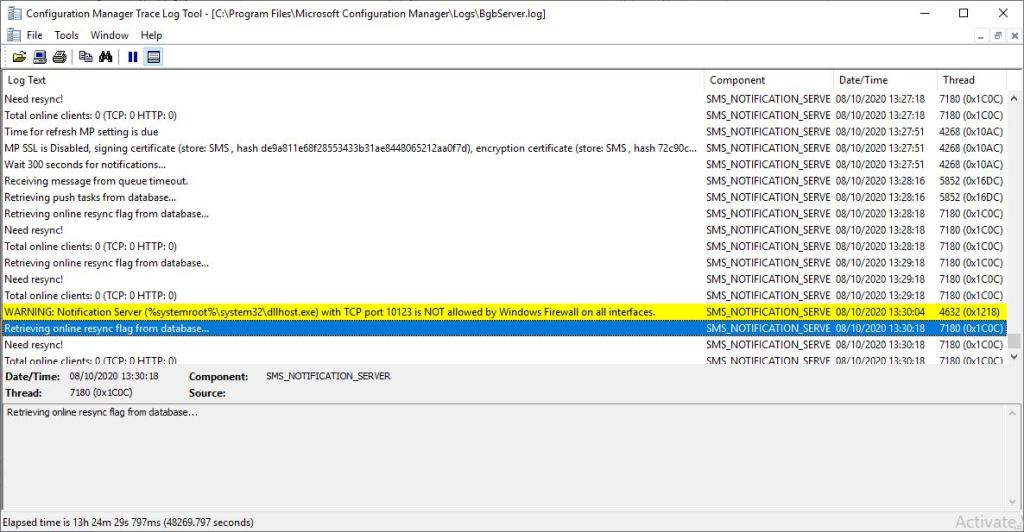
OK so what next? Time to look at the logs suggested in the description field of the client action health window.
The only thing obvious was a warning that TCP port 10123, used for client notification, was not allowed through the firewall. So, the next step was to add in a firewall rule to allow.
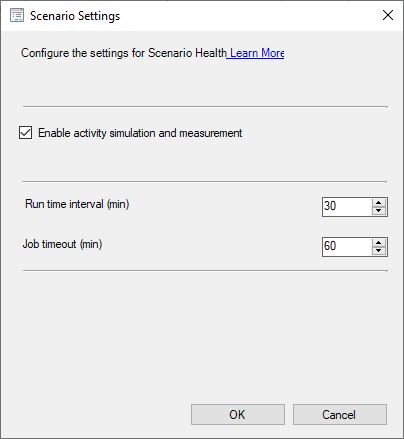
The health scenarios run by default every 30 minutes. You can adjust these timings by right clicking the scenario and selecting Scenario settings. Note, each scenario can be set with different run time intervals and timeouts.
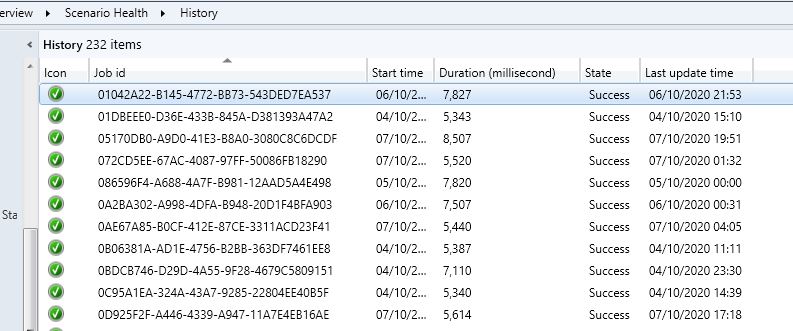
You can see the history of each execution of the scenario in the History section.
To speed up the process, I right-clicked the Client action health scenario and selected Run Now.
Sure enough, after the scenario had completed execution, every look good with green ticks across the board.
One thing I did notice, is that when executing the scenario, the ‘running’ icon stays in this state. There’s no refresh button to check again. You have to exit out of the node and back in to see if it has completed. I’ve sent some feedback to the product group, so let’s hope this gets added in.
I’m loving this new feature and I’m hoping this will be expanded out to other scenarios over the next few TP releases and, fingers crossed, hits the Current Branch releases sooner rather than later.
